It was surprising as well as unfortunate that the five-month-long trade negotiations between the U.S. and China ended abruptly May 10th with the U.S. increasing tariffs from 10% to 25%, on $200 Billion of Chinese imports. It is unclear whether a new round of talks to de-escalate trade tensions will occur soon. Were the new tariffs to remain for a lengthy time, China’s world factory, global supply chains, and the U.S. import and distribution system could be disrupted in a significant way.
In addition to the new tariffs from both sides, the latest skirmish in the trade dispute involves non-tariff barriers to trade, particularly in the arena of technologically sophisticated goods. On May 15, 2019 President Trump ordered the U.S. Department of Commerce to restrict the sale and purchase of telecommunications equipment with foreign firms that might pose a security risk. The following day Huawei and its affiliates were given notice that they were subject to these new restrictions. This notification has already affected sales and investment plans worldwide.
The questions are: How long will it continue? And what will be the impact on each of the two economies?
Given the irreconcilable differences between the philosophies and economic policies of the two countries that we discussed in the first in this series of Cathay Bank / UCLA Anderson Forecast economic reports, and the recent escalation of trade tensions, it appears that the two largest economies in the world are moving in a direction that some have named the Thucydides Trap. This describes a situation in which a rising power and the existent dominant power move inexorably towards conflict. In this case it is economic conflict that goes beyond market-based competition. The recent trade skirmishes make it clear that the flash points in the dispute are now consumer goods, intermediate and final manufactured goods, and technology.
The questions are: How long will it continue? And what will be the impact on each of the two economies? After a year of on-and-off negotiations, we have learned that even though the basis for the positions of the two countries are understood, it will be hard to predict the political bottom lines and responses for both sides. The length of time and degree of intensification of the trade dispute will be the telling factor in the costs and negotiating positions of the two countries.
Given the persistent uncertainty of the US-China economic relationship, we expect an accelerated exodus of manufacturers from China to avoid current 25% tariffs and the potential for an additional 25% tariff on the balance of Chinese exports in the future. The exodus was a move already underway in response to increasing wages in China and competition from South and Southeast Asia. The speed of the move of labor-intensive manufacturing will dictate the size of the disruption. On the Chinese side, a more gradual adjustment had already been planned for. A more rapid adjustment, however, will slow growth and divert attention from other economic priorities. On the U.S. side, consumers will see higher prices from both the adjustment costs of trade diversion including supply chain disruption (trade that moves to another country solely due to tariffs) and from the imposition of tariffs on the hundreds of billions of dollars of goods that will still be imported from China. y most advantageous locations will impose costs on both the U.S. and China.
Although it is speculative to infer from a single event as shifts in the demand and the supply of goods are continually occurring, recent trade flows are instructive. Over the past year U.S. tariffs on Chinese goods have been at 25% of value for $50 Billion of imports and at 10% of value for $200 Billion of imports, and Chinese tariffs have been at 10% on a smaller, but strategically significant set of U.S. exports.
Figure 1 compares the value of goods imported into the U.S. from its major trading partners between the first quarter of 2018 and the first quarter of 2019. This covers the period from before the initial tariff skirmish to the period prior to the most recent skirmish. There are only two countries with a decline; China at -14% and Canada at -3%. U.S. imports increased from Vietnam (40%), Taiwan (21%), South Korea (18%), India (15%), the E.U. (5%), and Mexico (5%). Note that China has now fallen to second next to the E.U. as source of U.S. imports.
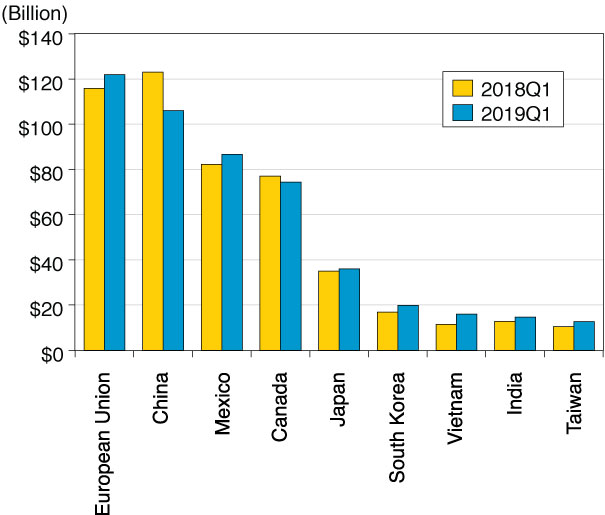
Figure 2 shows a comparison of U.S. goods exported to its major trading partners for the same period. Only three trading partners had a decline; China at -19%, Hong Kong at -23%, and Canada at -1%. U.S. exports increased to India (19%), Vietnam (17%), Taiwan (16%), the E.U. (11%), and Japan (5%).
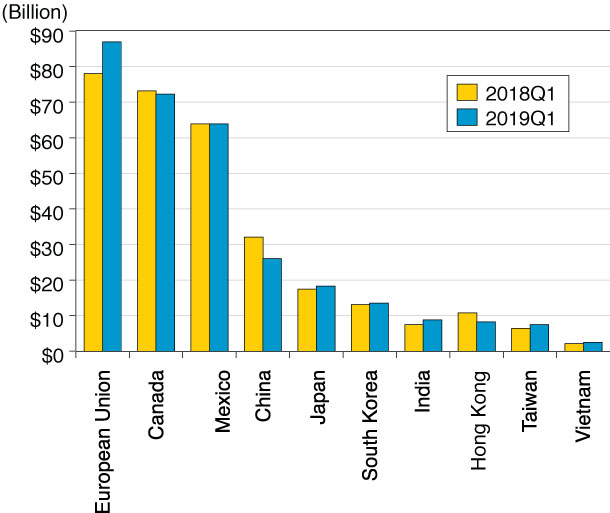
Figure 3 displays imports into the U.S. by sector from the first quarter of 2018 to the first quarter of 2019. The largest decline at -19% is in oil & gas imports. This, of course, is due to the oil production boom in the U.S. The second largest decline is in the computer & electronic products sector at -5% going from $95B to $90B, some of which is likely due to tariffs on Chinese imports. The third is primary metals imports going from $25B to $22B. Tariffs on steel and aluminum imposed in March 2018 are perhaps the major contributory factor for that sector. Transportation equipment (e.g. cars and aircraft) led with the largest increase going from $97B to $102B, with automobiles from Mexico leading the increase.
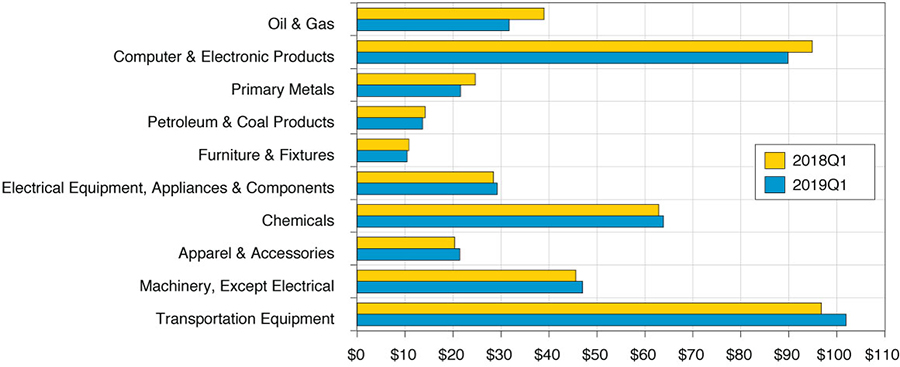
Figure 4 is a similar list for export products from the U.S. The largest decline is for primary metals at -17% going from $16B to $13B due, at least in part, to retaliation from foreign countries in response to U.S. aluminum and steel tariffs. The second largest decline is for agricultural products at -6% going from $18B to $17B mostly due to retaliation by China for U.S. tariffs. The largest increase in U.S. exports was in oil and gas products; increasing from $15B to $21B.
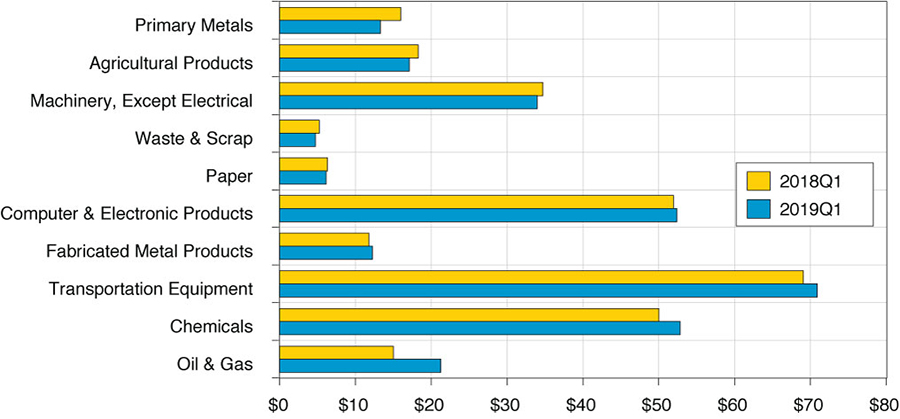
Figure 5 exhibits the top 10 imports into the U.S. from China ordered by the magnitude of decline from 2018Q1 to 2019Q1. The largest decline is in the computer and electronic products sector going from $42B to $32B a decrease of 25%. The impact on this sector is telling. To take a closer look, Figure 3 shows that the decline in total U.S. imports of computer & electronic products is only $5B. What caused the difference? The answer is, at least in part, a relocation of the supply chain for these products inclusive of final assembly (that defines the origin of the good for import purposes). Further anecdotal evidence of this phenomenon is seen in Figure 6. There is a dramatic increase of U.S. imports of computer & electronic products from three countries: Vietnam from $3B to $6B, a 109% gain, Taiwan from $3.7B to $5.9B, a 45% gain, and South Korea from $3.6B to $4.5B, a 24% gain.
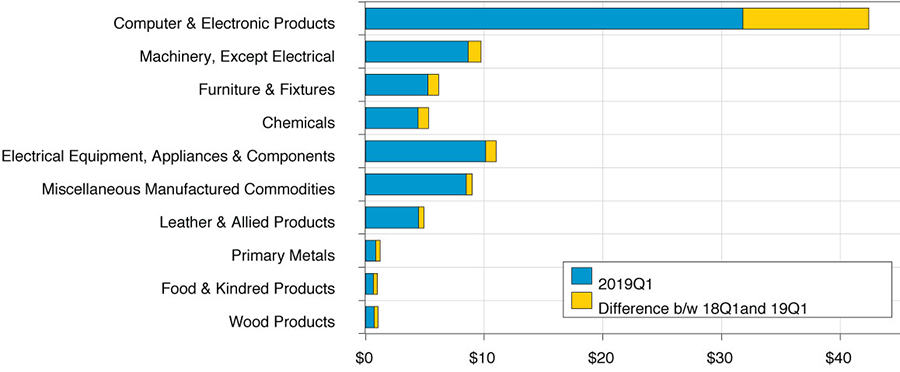
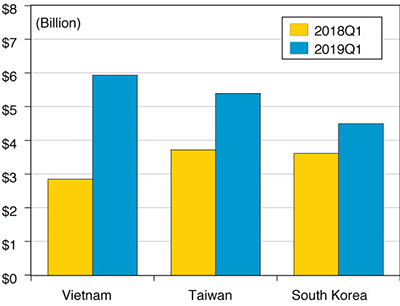
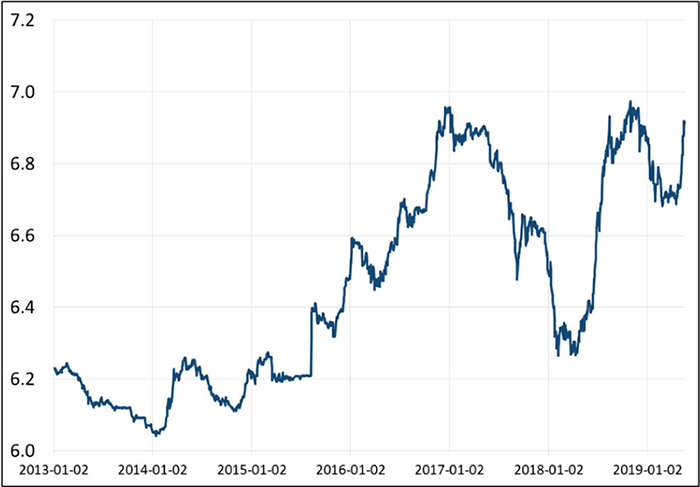
Figure 7 displays the China/U.S. foreign exchange rate since 2013. With the recent announcement of increased tariffs, the Renminbi (CNY) quickly depreciated from 6.7 to 6.9 to the dollar. We see a similar pattern of CNY depreciation from 6.3 in April to 6.9 in November 2018. This recent 3% devaluation has had the impact of offsetting part of the rising cost of exports burdened with tariffs. For example, if the price of a computer is $600 and it is hit with a 10% tariff, the price will increase to $660 all other things held constant. If, however, the CNY falls by 3% due to a depreciated currency, the US price becomes $582 prior to the tariff. With the tariff this price will increase by 10% to $640.20 a net increase of 6.7%. That increase in net price is mostly a tax on US retailers and consumers.
Somewhat to our surprise, the moderate deal that might have been, is at present not on the horizon. The public face of both countries is one that is dominated by hawkish opinions about what they are willing to accept in a trade deal. It is therefore hard to see how a new trade agreement can be reached in the near future. President Trump has been trying to build up support from hard-hit American farmers with agricultural subsidies and patriotic rhetoric. In China the media have been playing movies depicting the China/US conflict during the Korean War, and there are officially sanctioned reminders of the Century of Humiliation and Unequal Treaties that the CCP fought against. These are not easy positions to back away from.
Even though there is a trade deal down the road, the structural problems causing the current trade disputes will remain. That is to say, in the era of “America First” vs. “China Dream”, strategic competition will be the new normal for at least the next few years. We should expect and prepare for persistent trade skirmishes, including non-tariff barriers being erected, and the development of new trade and investment patterns between not just the US and China, but other countries as well. Although there will be economic gains from countries in South Asia, Southeast Asia, and Latin America, this diversion of trade from it economically most advantageous locations will impose costs on both the U.S. and China.
Cathay Bank has established a sponsorship relationship with UCLA Anderson Forecast to produce a U.S.-China Economic Report. In this report, UCLA Anderson Forecast will talk about their view of economic analysis and perspective on the current and future outlook relating to the two largest economies in the world – the United States and China.
UCLA Anderson Forecast has been the leading independent economic forecast of both the U.S. and California economies for over 65 years. The annual report and quarterly columns written by UCLA Anderson Forecast will focus on current topics affecting investment flows and associated economic events between China and the United States.
This report includes forecasts, projections and other predictive statements that represent UCLA Anderson Forecast’s economic analysis and perspective on the current state and future outlook of the economies of The United States and China in light of currently available information. These forecasts are based on industry trends and other factors, and they involve risks, variables and uncertainties. This information is given in summary form and does not purport to be complete. Information in this report should not be considered as advice or a recommendation to you or your business in relation to taking a particular course of action and does not take into account your particular business objectives, financial situation or needs.
Readers are cautioned not to place undue reliance on the forward-looking statements in this report. UCLA Anderson Forecast does not undertake any obligation to publicly release the result of any revisions to these forward-looking statements to reflect the occurrence of unanticipated events or circumstances after the date of this report. While due care has been used in the preparation of forecast information, actual results may vary in a materially positive or negative manner. Forecasts and hypothetical examples are subject to uncertainty and contingencies outside UCLA Anderson Forecast’s control.
Jerry Nickelsburg joined the UCLA’s Anderson School of Management and The Anderson Forecast in 2006. Since 2017 he has been the Director of The Anderson Forecast. He teaches economics in the MBA program with a focus on Business Forecasting and on Asian economies. He has a Ph.D. in economics from the University of Minnesota and studied at The Virginia Military Institute and George Washington University. He is widely published and cited on issues related to economics and public policy.
William Yu joined the UCLA Anderson Forecast in 2011 as an economist. At Forecast he focuses on the economic modeling, forecasting and Los Angeles economy. He also conducts research and forecast on China’s economy, and its relationship with the US economy. His research interests include a wide range of economic and financial issues, such as time series econometrics, data analytics, stock, bond, real estate, and commodity price dynamics, human capital, and innovation.