
There is no end in sight to a deteriorated U.S. / China relationship. In previous reports we have documented the implication of this for U.S. / China economic relations. Our projections have not changed since our July report, entitled Eye of the Storm. The bottom line is that both Chinese and U.S. firms are reassessing the risk of having cross border activity and some, perhaps many, are making plans to cut back. That we do not see this in the trade data is indicative of the difficulty of unraveling supply chains that have been built over the past 25 years. Nevertheless, we expect supply chains to be reconstituted in the coming years, and risks and opportunities for Chinese firms in the U.S. and U.S. firms in China to change in profound ways. In this report, we update the political and economic events of the past three months and focus on two industries in the U.S. with a heavy Chinese presence: tourism and real estate.
In the political realm, the U.S. ambassador to China, Terry Branstad, will step down in October after China’s People’s Daily refused to publish his op-ed. Of note is the fact that Branstad has known Xi Jinping since 1985 when Xi visited the U.S. Therefore, his departure could mean more distant and less personal diplomatic exchanges between the U.S. and China. Cabinet Secretary Azar’s visit to Taiwan, the visit by the Undersecretary of State, and the announcement of a planned major arms package sale to Taiwan infuriated China. China’s response, other than a reminder that it views Taiwan as a break-away province, was to increase military operations in the Taiwan Strait and in the South China Sea. China has warned the U.S. about “provocation” flights in the South China Sea as well.
On the economic front, the U.S. ordered the Chinese company ByteDance to sell its U.S. operations of TikTok and as of this report has banned downloads, updates, and data sharing for Tencent’s WeChat app. The stated reason for these actions is a concern about economic and national security. The U.S. sanction against China’s telecom giant Huawei became effective September 15. While these particular mandates from the Trump administration will be challenged in U.S. courts, the trend in these mandates is clear. All of them represent a U.S. effort to decouple technology from China and to thwart or slow down China’s efforts to become a global leader in high-tech. China has crafted a retaliatory response, but as of this report the affected U.S. companies are as yet not known.
The U.S. distrust and animosity toward China are now bipartisan. As an example of this, Senate Democrats rolled out a comprehensive legislative proposal to confront and counter China: the America Labor, Economic Competitiveness, Alliances, Democracy and Security Act (America LEADS). Even though the outcome of the November election is unknown at this time, a return to the engaged relationship both countries previously enjoyed is not likely.
For both countries, the economic outlook remains positive. However, there are risks in that forecast. For China, these are in soft domestic demand, high corporate and SOE debt levels, and an increasingly uncertain export environment in South East Asia and Europe. For the U.S. these are in contractions in state and local governments, a wave of new business failures, and a return of closures due to the pandemic. For both, there is uncertainty with respect to the aforementioned deteriorated political relations affecting the business environment in a much deeper way.
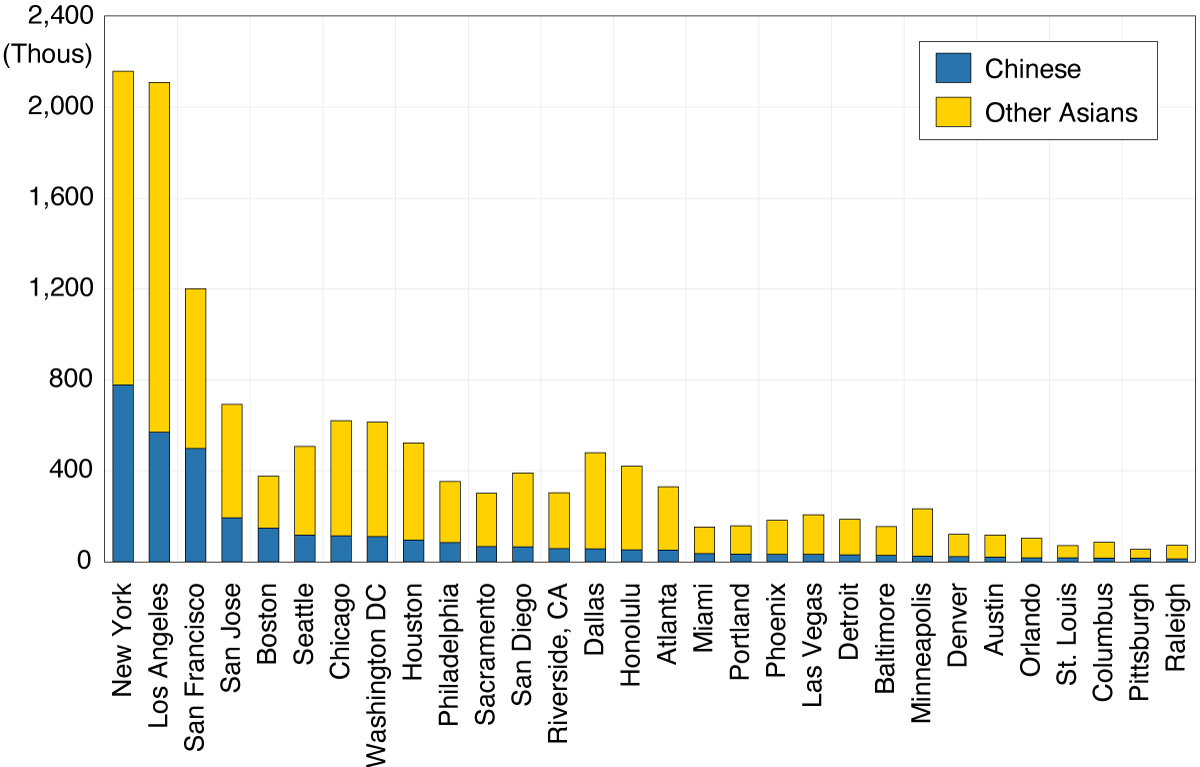
It is difficult to ascertain what properties are owned by Chinese nationals as investments, what are owned by Chinese nationals attending school in the U.S. as an alternative to renting, and what are owned by immigrants. Therefore, we will not distinguish between them in this high-level look at U.S. real estate markets and the impact of the trade war and the pandemic. According to the American Community Survey, in 2018, there were approximately 4.2 million Chinese and Chinese born Americans living in the U.S. The metropolitan area with the largest number is New York with 780,000, followed by Los Angeles/Orange County at 570,000, San Francisco/San Mateo at 500,000, and San Jose at 194,000.
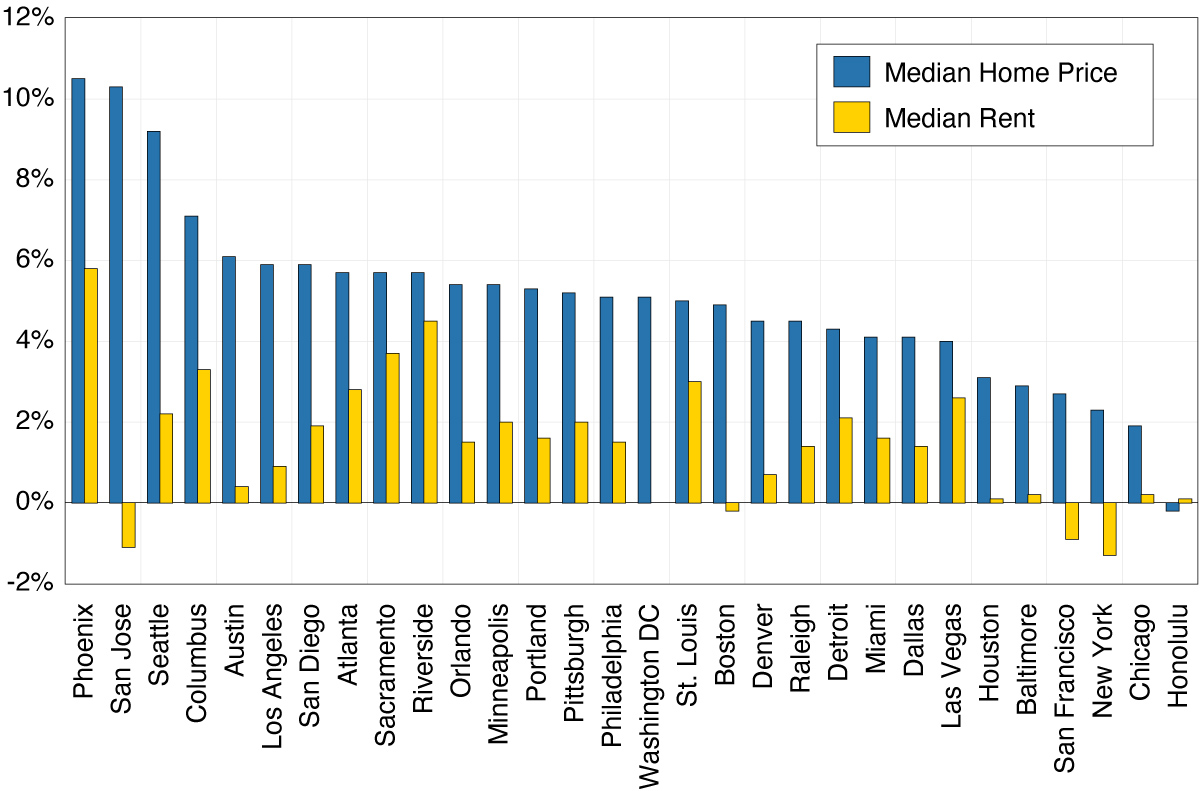
The year-over-year growth rates of median home prices and median home rents for the first eight months of 2020 is shown in Figure 2. Phoenix’s real estate market was on fire with a median price growth of 10.5% and rental rate growth of 5.8%. San Jose was the second with median price growth of 10%, followed by Seattle at 9%, Columbus at 7%, and both L.A. and San Diego at 6%. San Francisco, New York, Chicago, and Honolulu were at the low-end of home price appreciation over these 12 months.
While there is variation in the growth rates of prices in U.S. housing markets, most markets have had positive home price appreciation. In contrast, rents have not risen as fast during the same period. In Figure 2, we can see that four cities — New York, San Jose, San Francisco, and Boston — experienced declining rents over the past year.
Among the factors affecting urban rental demand is the advent of remote working. Previously, professionals in the tech and finance industry, for example, had to be in the urban core to collaborate and network with colleagues. An additional benefit was the enjoyment of urban amenities, such as restaurants, bars, theater, and symphony. With public health induced restrictions, much of these amenities are not currently available. For professionals whose residence is some distance from their office and who maintained a pied-a-terre in the city, there was no longer a reason to continue to hold onto the rental unit.
Second, cities with significant university offerings attract students from elsewhere; students who require rental units. In 2019 there were over one million foreign students, of whom 37% were from China. Virtually all international students require housing. With classes online for the fall and visa restrictions, particularly for Chinese students, keeping a significant portion of international students in their home country, the demand for rental units declined.
Third, from the demographic data we know that Millennials have been postponing childbearing. For those who were planning on moving to the suburbs and adding little ones to their family in the near future, the loss of urban amenities reduces the incentive to stay in the urban core. In this case, the shift to the suburbs would have happened anyway, just not as soon.
While each of these factors has clearly affected the housing market in cities around the country, it is not possible at this time to tell how much can be attributed to each. There is also anecdotal evidence of some permanently leaving coastal cities to work remotely, or fleeing to the suburbs for more social distance, but it remains to be seen if this is a significant factor.
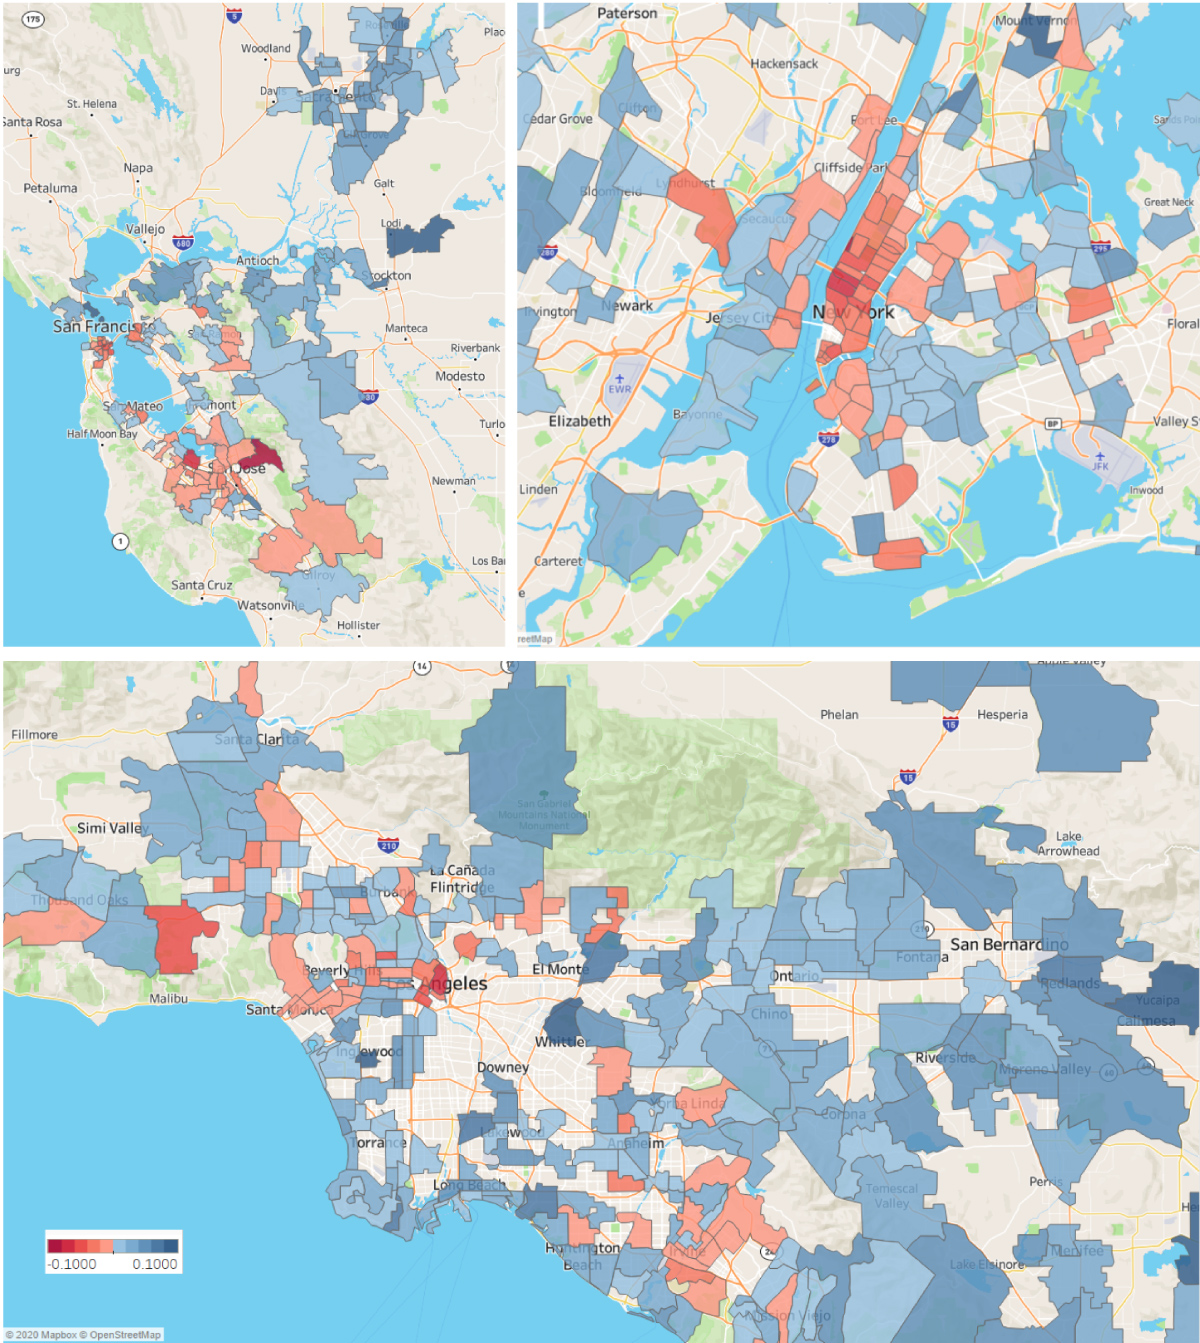
Figure 3 shows the year-over-year growth rate of median rent by zip code for three major metropolitan areas with significant Asian populations. In the Bay Area (on the top left), there are declines in both San Francisco and Silicon Valley where rents and density are high, and there are increases in suburban areas and in Sacramento where rents and density are lower. For New York, there is a similar pattern; rents declined in Manhattan while suburban areas had positive rental growth, while in sprawling Los Angeles, rental markets are not as closely tied to residential density.
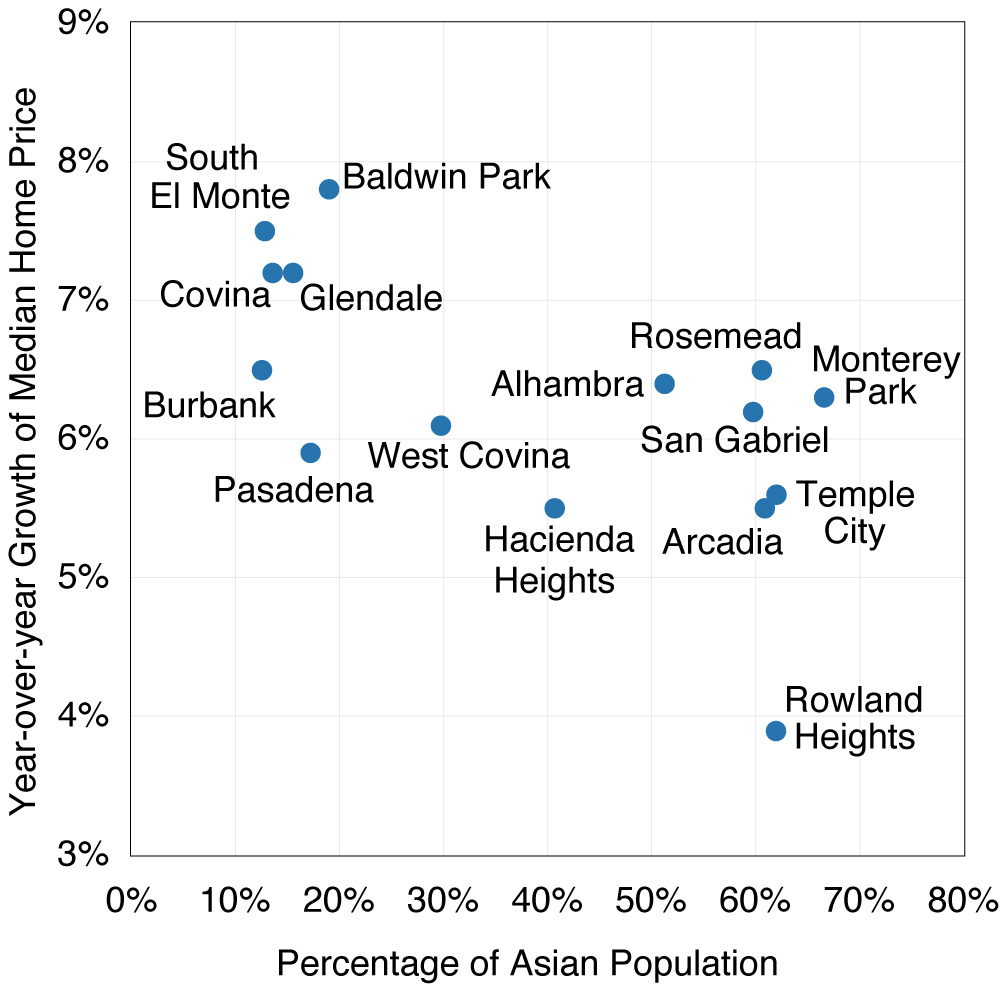
Did the rising tensions between the U.S. and China impact Chinese investment in the U.S. real estate markets? Los Angeles County in and around the San Gabriel Valley provides some insight. Assuming that new Chinese overseas real estate investment is more likely in locations with a higher concentration of Chinese or Asian residents, then the differential between these and other neighborhoods will show the presence or absence of changes in overseas demand relative to domestic demand. Figure 4 is a scatter diagram of the percentage of the population which is Asian and the year-over-year home appreciation. From the scatter, there appears to be a negative correlation between the two. Though the sample is small and therefore not conclusive, the new Chinese capital controls instituted in August of 2019, a stronger dollar, the ongoing pandemic, and increasing tensions between China and the U.S. may have effectively dried up significant net new demand in markets with a higher concentration of Chinese residents. Indeed, China’s capital controls were explicitly aimed at Chinese overseas real estate investments, and the data show that the total volume of new investment by Chinese in the U.S. has been falling since then.
Not surprisingly, caution by consumers and public health regulations due to the COVID-19 pandemic hit the leisure and hospitality industry hard. In this section, we present an analysis of one part of that sector: hotel and motel accommodations. Included in this sector are everything from luxury hotels to inexpensive roadside accommodations. According to the research firm STR,1 the August 2020 hotel occupancy rate was 48.6%. In California it was 57.7%.2 The decline from the same month one year previous was 31% for the U.S. and 27.3% for California. The average room rate for the U.S. declined by 22.7% and for California by 29.2% over the same period. Taken together these represent a dramatic fall off in hotel and motel revenues. As the California numbers will demonstrate, the impact on the industry has been quite uneven.
International tourism is an important part of the hotel industry, particularly for California, New York and Florida. In 2018, 1.5 million Chinese visitors came to California. Of those, 60% stayed in hotels. From March to July of this year there have been about 70,000 more international passengers departing through LAX than arriving, and the number of arrivals has been quite small. Even today there are very few flights between California and China compared to 2018.
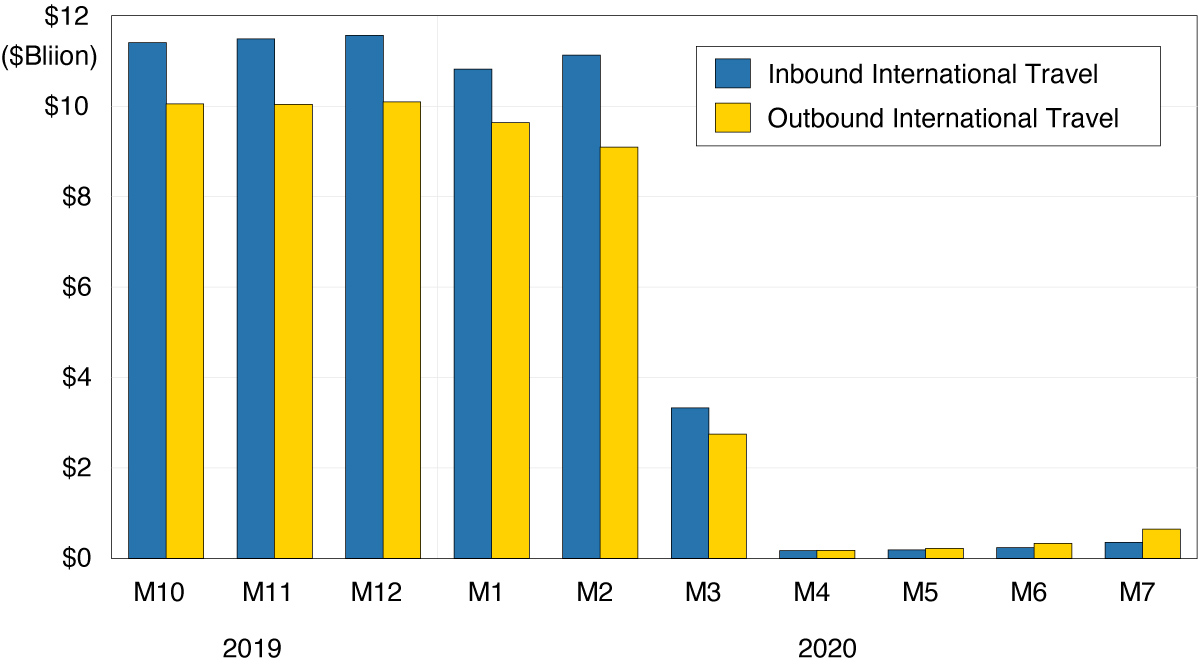
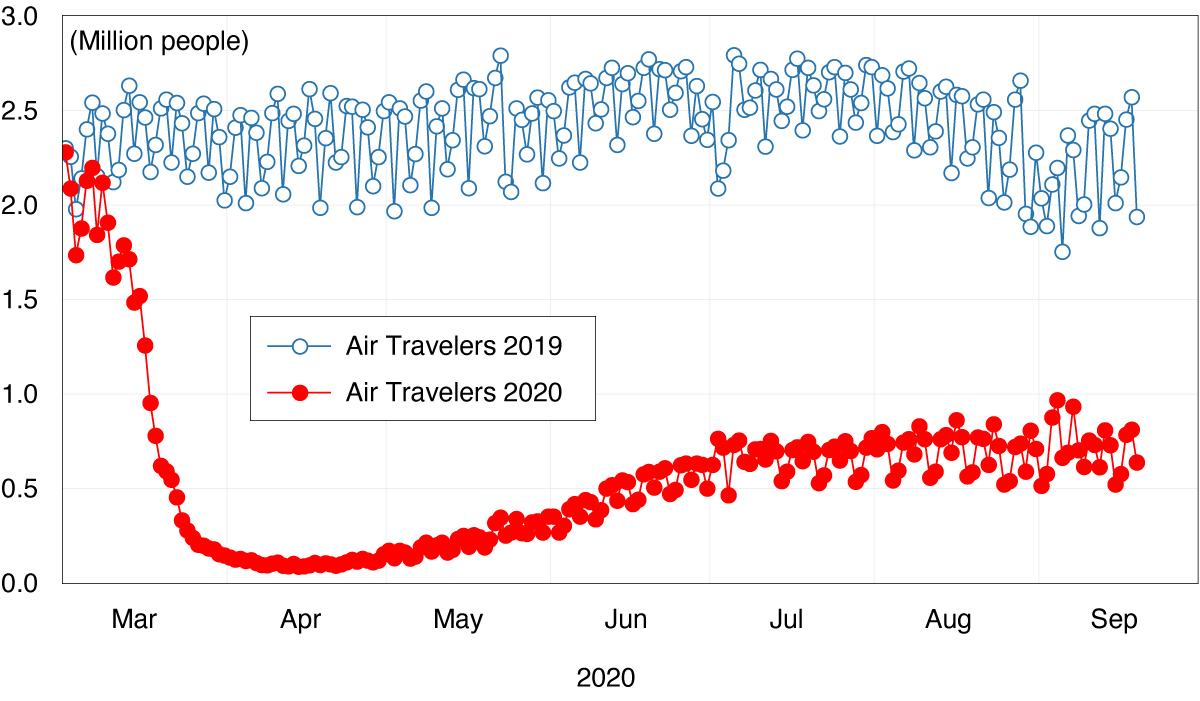
The fall-off of expenditures from all international tourists provides further confirmation. Monthly travel spending by international tourists was down more than 95% in July (blue bars in Figure 5). Expenditure data also indicates that Americans are not travelling abroad for vacation as well (yellow bars in Figure 5), and they are also not flying domestically on vacation. According to TSA (Figure 6), the total number of air travel passengers going through security checkpoints is down by 70% in September in 2020 as compared to 2019.
With business travel now at a minimum, foreign visitors absent, and American tourists not traveling long distance, one would think the occupancy rates would be much lower. And with California hosting 25% of all international tourists, the largest group of them coming from China, one would expect California occupancy rates to be lower than the national rate. These numbers are reconciled by two factors. First, the great American road trip has come back as an attractive alternative to spending hours in an aluminum cylinder soaring across the skies. As not everyone is enamored of sleeping in a tent, many of these road trips created a demand for hotel accommodations. However, unlike upscale hotels and resorts, road trip lodging tends to be more modest. This is part of the explanation for the decline in average daily room rents.
But then why did California have a higher occupancy rate than the nation? The principal reason for the differential is wildfires. This past August is one of the worst fire seasons in the U.S. West. The tragedy of these have forced evacuations and increased the demand for lodging. In addition, the extent of these fires has brought disaster relief workers and firefighters into the state from across the country. Both of these increase the demand for modest lodging and increase the occupancy rates.
Autumn comes with rains dampening Western fires, an ending of the hurricane season and the ending of summer vacations. This seasonal fall-off in the demand for hotel and motel accommodation is normally moderated somewhat with shoulder season foreign tourists. We don’t expect that to happen this year. Moreover, the continued tensions between the U.S. and China will dampen this source of hotel demand through at least 2021. Overall, our forecast for this industry depends crucially on the course of the pandemic and the return to normal vacation habits. The expectation is that a full recovery in the hotel and motel industry to the levels experienced in 2019 will be sometime beyond 2022, perhaps several years beyond.
While the economic outlook is for recovery over the coming two years, the outlook for international tourism and home prices, particularly in parts of the U.S. with large Chinese and Chinese American populations is not as optimistic. Tourism will be restrained by the course of the pandemic and the related household perceptions of the health risk in travel. Home prices will continue to be restrained by Chinese capital controls, the continuation of tensions between the U.S. and China, and U.S. restrictions on immigration and on visas for Chinese students. In these two sectors, the COVID19 pandemic has exacerbated the impact of deteriorating economic relations between the two countries, and will continue to do so for some time.
Cathay Bank has established a sponsorship relationship with UCLA Anderson Forecast to produce a U.S.-China Economic Report. In this report, UCLA Anderson Forecast will talk about their view of economic analysis and perspective on the current and future outlook relating to the two largest economies in the world – the United States and China.
UCLA Anderson Forecast has been the leading independent economic forecast of both the U.S. and California economies for over 65 years. The annual report and quarterly columns written by UCLA Anderson Forecast will focus on current topics affecting investment flows and associated economic events between China and the United States.
This report includes forecasts, projections and other predictive statements that represent UCLA Anderson Forecast’s economic analysis and perspective on the current state and future outlook of the economies of The United States and China in light of currently available information. These forecasts are based on industry trends and other factors, and they involve risks, variables and uncertainties. This information is given in summary form and does not purport to be complete. Information in this report should not be considered as advice or a recommendation to you or your business in relation to taking a particular course of action and does not take into account your particular business objectives, financial situation or needs.
Readers are cautioned not to place undue reliance on the forward-looking statements in this report. UCLA Anderson Forecast does not undertake any obligation to publicly release the result of any revisions to these forward-looking statements to reflect the occurrence of unanticipated events or circumstances after the date of this report. While due care has been used in the preparation of forecast information, actual results may vary in a materially positive or negative manner. Forecasts and hypothetical examples are subject to uncertainty and contingencies outside UCLA Anderson Forecast’s control.
Jerry Nickelsburg joined the UCLA’s Anderson School of Management and The Anderson Forecast in 2006. Since 2017 he has been the Director of The Anderson Forecast. He teaches economics in the MBA program with a focus on Business Forecasting and on Asian economies. He has a Ph.D. in economics from the University of Minnesota and studied at The Virginia Military Institute and George Washington University. He is widely published and cited on issues related to economics and public policy.
William Yu joined the UCLA Anderson Forecast in 2011 as an economist. At Forecast he focuses on the economic modeling, forecasting and Los Angeles economy. He also conducts research and forecast on China’s economy, and its relationship with the US economy. His research interests include a wide range of economic and financial issues, such as time series econometrics, data analytics, stock, bond, real estate, and commodity price dynamics, human capital, and innovation.

